Copper 图表
1 来自同行评审研究的图表
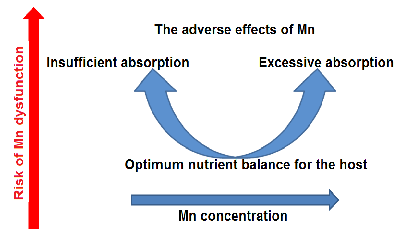
Figure 9
Chart
The U-shaped dose-response curve for manganese illustrates that both deficiency and excess are associated with adverse health outcomes. An optimal range exists where manganese fulfills its essential cofactor roles without triggering neurotoxic or systemic damage.
Consequences of Disturbing Manganese Homeostasis.